Background
The group project was done for the pilot of the Data Science Project course of Aalto University’s School of Computer Science. The organization client, Reaktor, wanted to make use of the Paavo open postal code data. Paavo data spanned from 2012 to 2017 and included population structures, education levels, employment, income, and housing prices. As the data features were closely related to factors that one would consider when moving to a new area, we chose to move forward with the relocation recommendation use case. The web application can be accessed at kodimpi.herokuapp.com.
Approach
Data Collection and Processing
Paavo data was collected through stat.fi PxWeb API and aggregated with pandas. Depending on each individual feature, missing values were imputed with zeroes, median values, regression, inference from similar data points. In addition to the Paavo data, open data sources including information on transportation, services, enviroment, and tax. The complimentary data was obtained using either their API if available or through scraping with Beautiful Soup. In the process, closely related features were combined while irrelevant features were omitted. Pricipal component analysis was applied to the data set to reduce the number of features from more than 170 to around 80. Lastly, the dataset was divided in 60 clusters of similar postal code areas using K-Means clustering, which would serve as the basis of the relocation recommendation.
Relocation Recommendation
For the personalized recommendation, some inputs are requested from the user such as age, occupation, physical distance from the current dwelling to form a new synthetic data point. The recommendations are points in the same cluster as the orinal area that have the lowest distances to the sythetic data point.
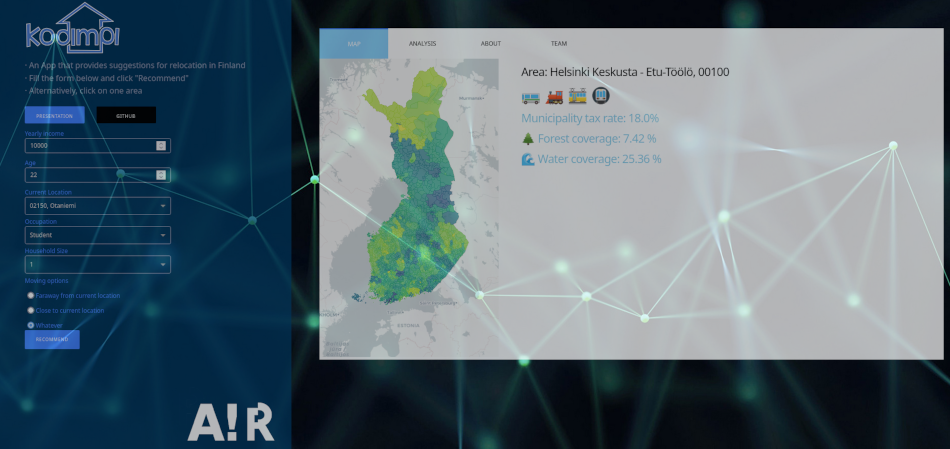
Web Application
The web application was created using Dash and hosted on Heroku. The application featured an interface for user input, a map with general information, and a comparision tab with more details such as housing prices and trends, income, and demographic information.
Additional Resources
More details of the project implementation can be found in the source code of the project, and the final report.